What is LLM monitoring? (Quality, cost, latency, and drift in production)
An LLM that performs well in development can still fail in production. Production LLMs can hallucinate sensitive information, generate unexpected costs, or respond slowly enough that users abandon the experience, and these failures only become visible once real users interact with the system.
Because LLM outputs are non-deterministic, a request can return a successful response while still producing hallucinated or harmful content that traditional monitoring tools cannot detect. LLM monitoring focuses on how AI applications behave in production. It tracks not only whether requests succeed, but also whether responses are correct, useful, and safe for users.
This guide explains how LLM monitoring works in practice. It covers the key metrics to track at each layer of an LLM application, how to define meaningful performance targets, and how to build monitoring systems that surface issues early rather than relying on user reports.
What is LLM monitoring?
LLM monitoring is the continuous observation of model performance, behavior, and outputs in production environments. LLM monitoring involves tracking prompts and responses, measuring latency and token consumption, attributing costs to specific features or users, and evaluating whether outputs meet quality standards.
Traditional application performance monitoring (APM) measures system health using metrics such as CPU utilization, memory usage, and request error rates. APM metrics indicate whether infrastructure is functioning but reveal nothing about whether an LLM's responses are accurate, relevant, or safe. An API can return a 200 status code while delivering a completely fabricated answer, and APM would report the interaction as successful.
LLM monitoring fills this visibility gap by examining the content and quality of model outputs alongside operational metrics. When a customer service chatbot starts recommending products that do not exist, LLM monitoring surfaces the issue via quality scoring, even though the underlying API calls succeed.
LLM monitoring vs. LLM tracing vs. LLM observability
Production AI systems rely on three different capabilities that work together. Monitoring tracks whether your system meets performance standards. Tracing captures what happens during individual requests. Observability combines both to explain why problems occur.
| Aspect | Monitoring | Tracing | Observability |
|---|---|---|---|
| Purpose | Tracks predefined metrics against thresholds to determine if performance is acceptable | Captures the full execution path of a request through your system | Combines monitoring, tracing, and evaluation to investigate arbitrary questions about system behavior |
| What it measures | Latency, error rates, token counts, cost per request, and other quantifiable metrics | Each step with timing information, input and output data, and metadata for exact reconstruction | Correlations between metrics, traces, and contextual factors like model version, prompt template, or user cohort |
| Key question answered | Is performance acceptable according to standards defined in advance? | What happened in this specific request? | Why did this problem occur? |
| Action triggered | Triggers alerts when latency exceeds targets or costs spike beyond budgeted amounts | Enables reconstruction of the request flow for debugging specific failures | Reveals root causes by connecting slow requests to specific model versions, prompts, or user segments |
| Example scenario | Alert fires when the average latency exceeds 500ms for the past 5 minutes | RAG application trace shows embedding generation, vector retrieval, context assembly, and multiple LLM calls for a single query | Latency increase correlates with the new prompt template deployed yesterday, affecting the Document Summarization feature |
| Scope | Aggregate metrics across all requests or specific segments | Individual request execution from start to finish | Holistic system understanding across time, users, features, and configurations |
The four layers of LLM application monitoring
LLM applications consist of multiple interconnected layers. Monitoring them separately creates clearer signals and a more reliable diagnosis.
Model calls layer
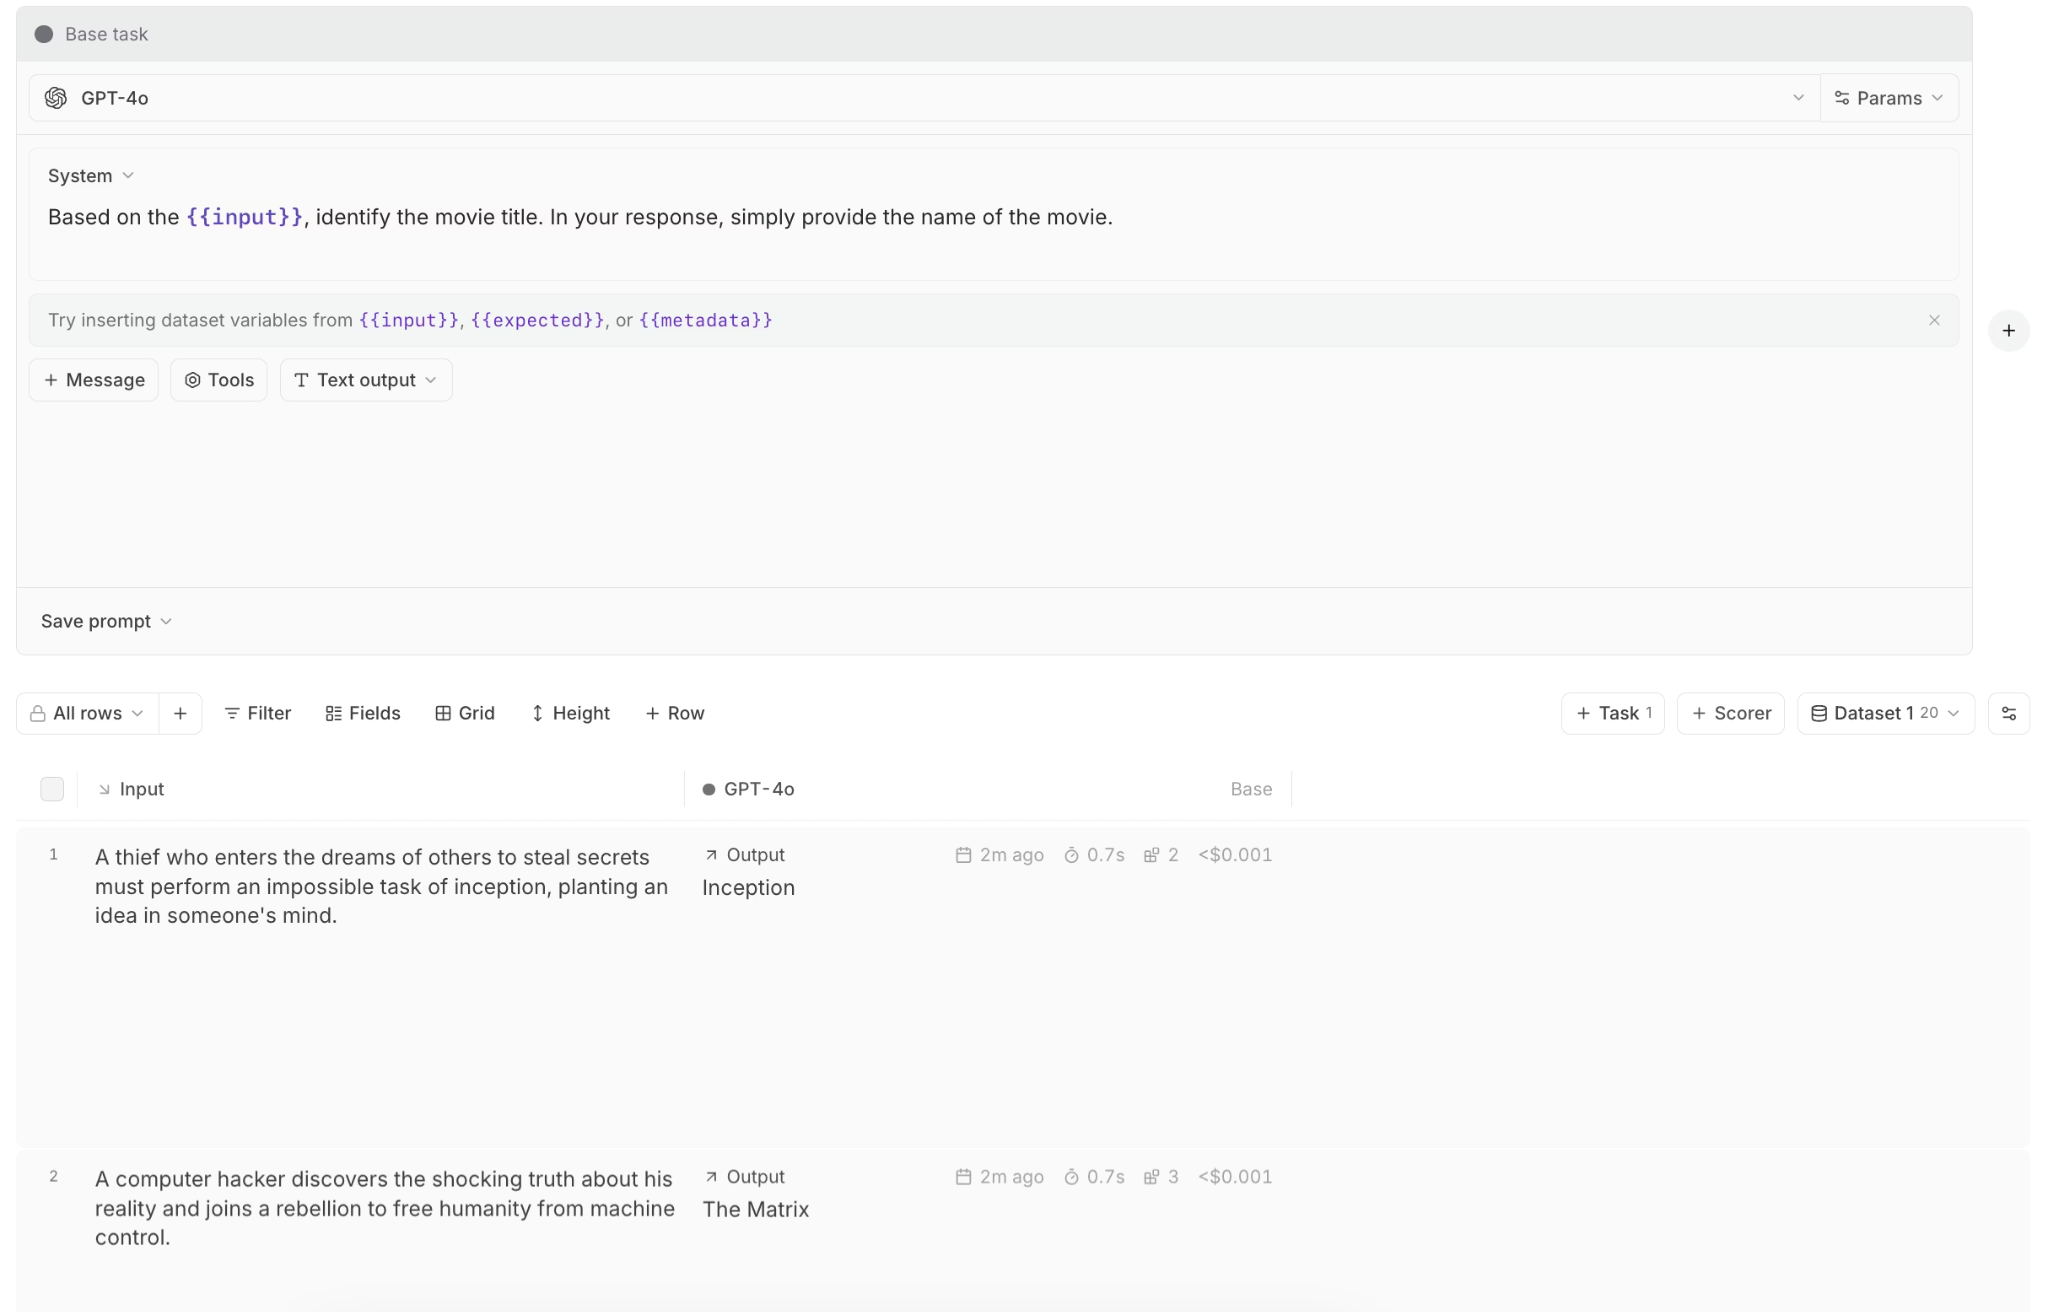
The foundation of any LLM monitoring system captures what goes into and comes out of model inference calls. Input prompts, system messages, model responses, and token counts constitute the baseline data on which all other analyses depend.
Latency metrics at this layer include time-to-first-token (TTFT), which measures how quickly users see the response begin streaming, and time-per-output-token (TPOT), which affects how fast the complete response appears. API errors and rate limits require tracking because third-party providers impose usage restrictions that can throttle applications without warning.
Retrieval-augmented generation layer
RAG systems exhibit failure modes that pure LLMs do not. The retrieval step can return documents that do not support the query, resulting in responses that appear authoritative yet lack factual grounding.
Context relevance scoring evaluates how well retrieved documents match the user's query, and while high scores don't guarantee correctness, low scores reliably predict poor outputs. Embedding drift occurs when the distribution of production queries shifts away from the data used to build vector indexes, causing queries that worked during development to return less relevant results over time.
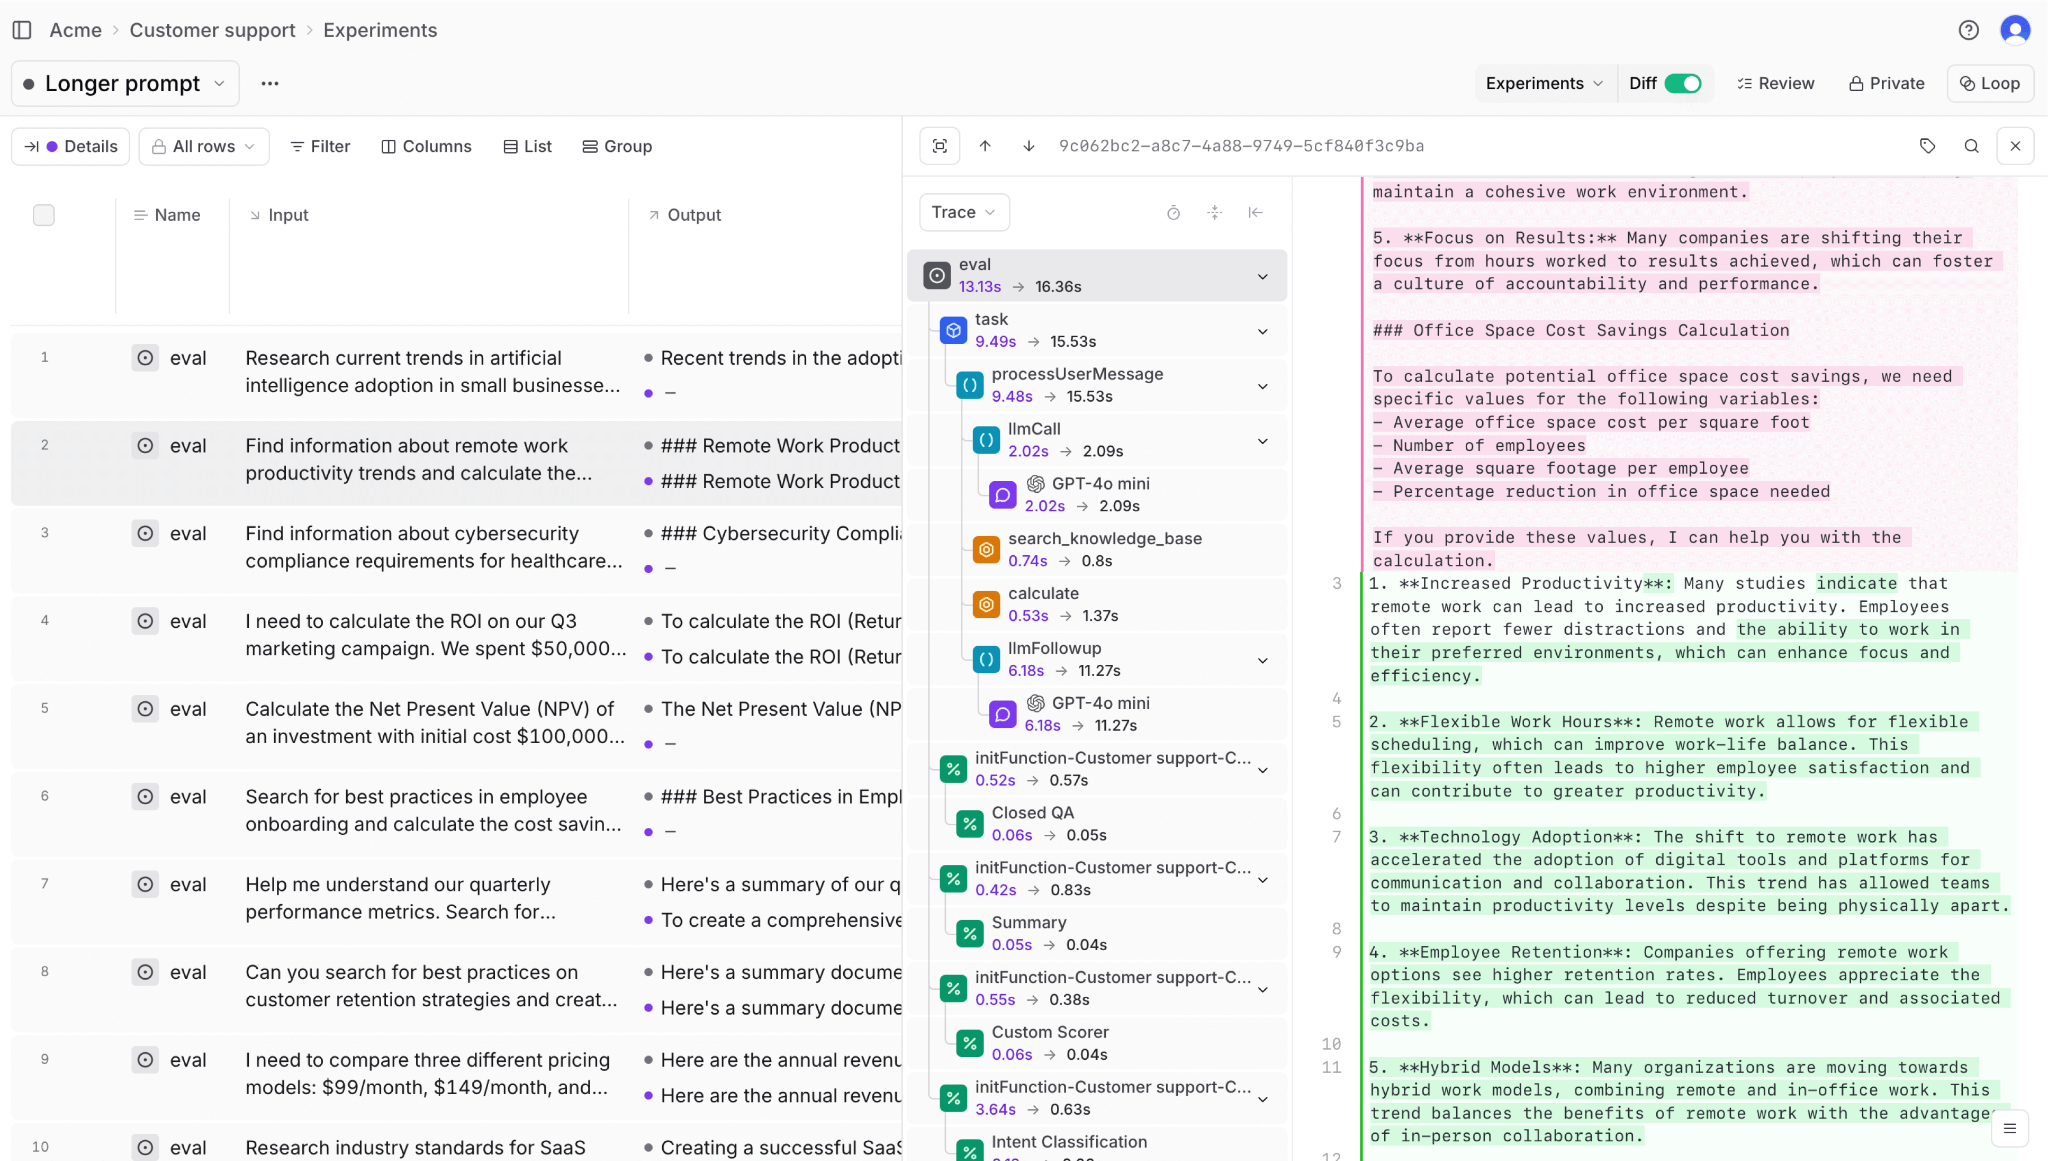
Agents and tool use layer
Agent workflows multiply monitoring complexity because a single user request can trigger chains of tool calls with branching logic and retry loops. Tool call success rates reveal which integrations cause the most problems, while agent loop depth and iteration counts expose inefficiency and potential runaway behavior.
An agent that takes fifteen steps to complete a task that should require three is wasting resources and user time. Monitoring iteration counts with alerts on outliers catches both inefficient execution and infinite loops before they exhaust budgets.
User feedback and downstream signals layer
Explicit feedback through ratings and comments provides ground truth about output quality that automated scoring cannot fully capture. Implicit signals include task completion rates, session abandonment, and re-prompting when users rephrase questions after unsatisfactory answers.
Business metrics tied to AI outputs close the loop between technical performance and organizational impact. Conversion rates on AI-generated recommendations, support ticket resolution times, and revenue from AI-powered features connect monitoring data to outcomes that justify continued investment.
Essential metrics for production LLM systems
Understanding how a live LLM application performs requires clear metrics that indicate whether users receive fast, reliable, safe, and useful responses. These metrics can be grouped into five core areas.
Latency metrics
Latency metrics indicate how quickly a system responds to user requests.
- Time to first token reflects how fast users see the response start, which strongly affects perceived performance.
- Time per output token determines how smoothly responses stream once generation begins.
- End-to-end latency captures the total delay across retrieval, processing, and generation.
- High-percentile latency highlights slow experiences that affect a small but important subset of users.
Cost metrics
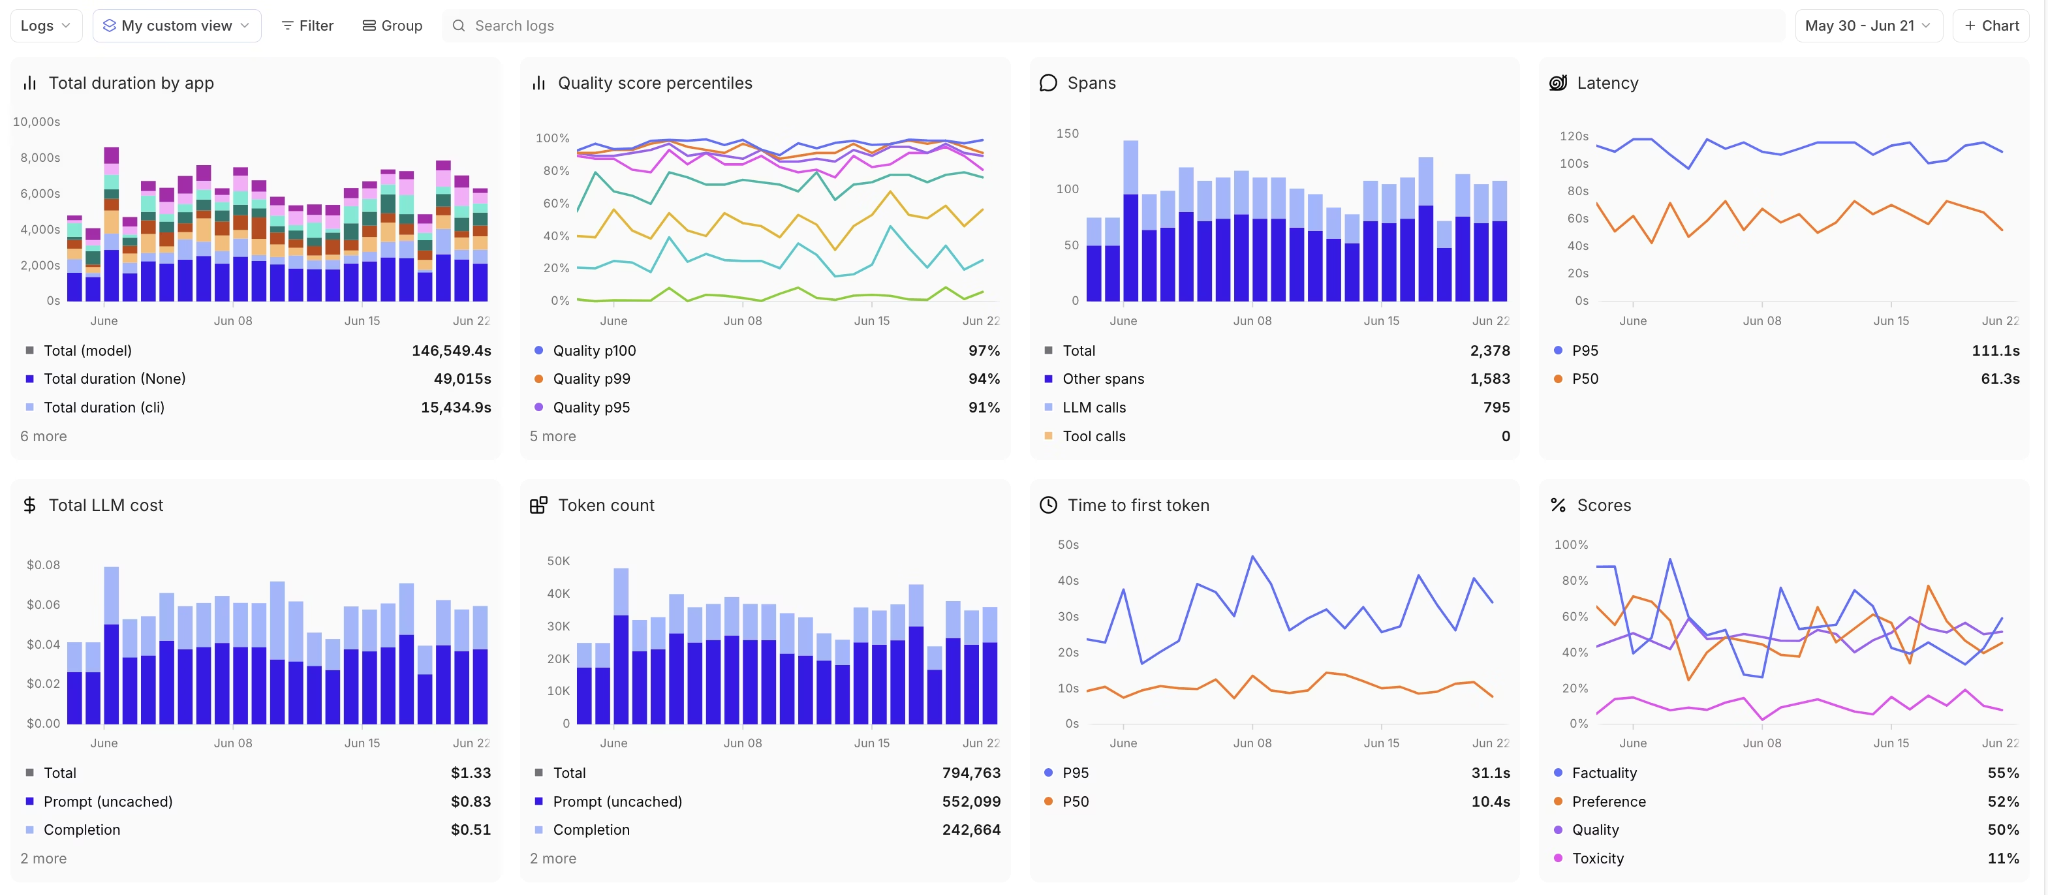
Cost metrics quantify how resources are consumed as the system scales. Token usage in prompts and completions directly drives spend, making it essential to track both over time. Cost per request and per feature connects usage patterns to business impact, helping teams identify inefficient workflows. Monitoring overall cost trends helps detect unexpected spikes before they cause long-term issues.
Reliability metrics
Reliability metrics measure how consistently a system performs under real-world conditions.
- Success rates and error types indicate whether failures are due to timeouts, rate limits, or upstream issues.
- Availability reflects how often the system can serve requests without interruption.
- Recovery behavior shows whether the system fails gracefully or leaves users stuck when something breaks.
Safety and compliance metrics
Safety and compliance metrics show whether the system produces harmful or restricted outputs. A rise in unsafe content usually indicates problems in prompts, guardrails, or user input patterns. Personal data exposure must be tracked closely because even a small number of incidents can create legal and trust risks. Guardrail activation rates help teams understand whether safety controls are effective or unnecessarily limiting normal responses.
Quality proxy metrics
Quality proxy metrics provide scalable signals about response usefulness and consistency.
- Automated scoring systems highlight changes in output quality without requiring manual review.
- Hallucination indicators help surface unsupported claims that can undermine trust.
- Relevance and coherence measures ensure responses remain aligned with user intent and logically structured over time.
Setting SLIs, SLOs, dashboards, and alerts for LLM systems
Metrics alone do not improve system reliability. Defining SLIs, SLOs, dashboards, and alerts establishes how performance is measured, visualized, and enforced in production.
Defining service level indicators (SLI)
Service Level Indicators (SLIs) are metrics used to evaluate system performance from a user perspective. Effective SLIs focus on experienced outcomes rather than the easiest-to-measure metrics.
For latency, a strong SLI is the proportion of requests for which the time to first token remains below an acceptable threshold, since this better reflects perceived responsiveness than averages. For quality, SLIs often measure the share of responses that exceed a relevance score threshold, which must be validated against real user satisfaction data. Reliability SLIs typically track successful request completion, with more advanced setups separating user-visible failures from internally handled errors.
Setting service level objectives (SLO)
Service Level Objectives (SLO) define acceptable targets for each SLI and should be realistic rather than aspirational. Targets below 100 percent avoid excessive effort for minimal user benefit, since improvements beyond high availability thresholds require disproportionate engineering investment.
Provider constraints must be reflected in SLOs, as upstream availability limits what applications can achieve without added complexity. SLOs should also vary by use case, since interactive features and background workflows have different performance requirements. Error budgets translate these targets into operational flexibility, allowing teams to balance experimentation and reliability without triggering unnecessary incidents.
Building effective dashboards
Dashboards provide visibility into system health across different time horizons. Real-time views support rapid response by highlighting fast-moving signals, while longer-term trends expose gradual degradation and drift.
Cost breakdowns by user, feature, and model help surface inefficiencies and unexpected usage patterns. Tracking quality score distributions over time reveals whether changes improve outcomes broadly or introduce uneven behavior across users.
Creating an alerting strategy
Alerting works best when tied to SLO burn rates rather than raw thresholds, which reduces noise while catching sustained issues early. Severity should reflect business impact, so critical failures receive immediate attention.
Alerts must include sufficient context to support fast diagnosis, such as affected features, model versions, or recent changes. Contextual alerts convert monitoring signals into actionable responses rather than vague warnings.
Rolling out LLM monitoring in phases
Phase 1: Instrument the basics
Adding tracing to capture all LLM calls creates the foundation for monitoring, and OpenTelemetry provides a vendor-neutral standard compatible with most observability platforms.
Logging prompts, responses, token counts, and latency for every request builds the dataset needed for later analysis. Storage costs for this data are typically minor compared to the insights it enables.
Establishing cost tracking from day one prevents budget surprises. Many teams discover months into production that a single feature consumes most of their API budget, but without tracking from the start, they cannot identify when the problem began.
Phase 2: Build evaluation baselines
Creating initial test datasets with 10-20 representative cases provides a foundation for regression testing. These cases should include normal queries, edge cases, and scenarios that previously caused problems.
Implementing automated scorers for quality dimensions enables continuous evaluation at scale. Start with basic relevance and coherence checks before adding domain-specific scorers.
Establishing baseline metrics before making changes allows meaningful comparison. Without baselines, improvements and regressions appear identical because there is no reference point for comparison.
Phase 3: Connect production to evaluation
Turning production failures into test cases builds evaluation coverage from real-world issues. When users report problems or monitoring surfaces quality drops, adding those cases to test suites prevents recurrence.
Building feedback loops from user signals to evaluation datasets ensures that evaluation reflects actual usage patterns. Highly-rated responses and frequently-corrected outputs both provide training signals for scoring systems.
Automating regression detection on prompt and model changes catches problems before deployment. Running the full evaluation suite on every change prevents shipping degradations that require emergency rollback.
Phase 4: Scale and refine
Expanding coverage to edge cases and long-tail scenarios improves robustness against unusual inputs. Production traffic reveals failure modes that synthetic test cases miss.
Implementing drift detection for inputs and outputs helps identify when production behavior deviates from baseline expectations. Both prompt drift, where user queries change over time, and output drift, where model responses shift, can indicate problems that require attention.
Tying monitoring to CI/CD for deployment gating ensures that quality checks run automatically and block releases that fail to meet standards. Manual quality gates create bottlenecks and depend on human diligence that exhausts over time.
Common monitoring failures and how to avoid them
Even well-instrumented LLM systems can fail if monitoring is poorly designed or misused. Most issues fall into a small number of recurring patterns that are avoidable with the right structure and discipline.
Focusing on averages instead of user experience
Many teams rely on average latency, cost, or quality scores to judge system health. Averages hide slow or broken experiences that affect real users, especially at scale.
To avoid this, track percentiles and distribution-based metrics. Pay close attention to tail latency, failure rates for specific user segments, and outliers that indicate degraded experiences.
Collecting metrics without clear ownership
Monitoring often fails when metrics exist, but no one is responsible for acting on them. Dashboards become passive reports instead of operational tools.
Assign clear ownership to each metric and alert. Every signal should have a defined response path, whether that means investigation, mitigation, or escalation.
Treating all metrics as equally important
When everything is monitored, nothing stands out. Teams become overwhelmed by dashboards and alerts that lack prioritization.
Group metrics by impact and purpose. Focus first on user-facing reliability, safety, and cost controls, then layer in deeper diagnostics as needed.
Alerting on noise instead of trends
Alerting on raw thresholds creates frequent false alarms from short-lived spikes. This leads to alert fatigue and delayed responses to real issues.
Base alerts on sustained degradation using error budgets or burn rates. This ensures alerts fire only when problems are meaningful and persistent.
Ignoring context around failures
Metrics without context make diagnosis slow and frustrating. Knowing that a metric changed is not enough to understand why it changed.
Attach metadata to monitoring signals, such as model version, prompt version, feature name, or recent deployments. Context turns alerts into actionable insights.
Overlooking quality and safety signals
Teams often prioritize latency and cost while treating quality and safety as secondary concerns. This creates blind spots that only surface through user complaints.
Include quality proxies and safety signals in core monitoring. Track them with the same rigor as performance metrics to catch issues early.
Monitoring systems in isolation
LLM applications depend on multiple components that interact in complex ways. Monitoring each system separately hides cascading failures.
Adopt a layered monitoring approach that connects infrastructure, model behavior, retrieval, agents, and user outcomes. Cross-layer visibility makes root causes easier to identify.
Why Braintrust is the right option for developers looking to do LLM monitoring
Traditional APM tools measure infrastructure health but cannot evaluate the quality of LLM output. Braintrust unifies operational monitoring and quality evaluation in a single platform designed specifically for LLM applications.
Comprehensive monitoring across all application layers
Braintrust captures signals across the entire LLM stack without requiring manual instrumentation. This ensures teams see how system behavior, model performance, and user outcomes connect.
Model inference: Braintrust tracks prompts, completions, token usage, TTFT, TPOT, and per-request cost. Spending is attributed to specific models, users, and features, making it easy to identify which workflows drive the highest costs.
RAG pipelines: Retrieval monitoring covers context relevance, embedding drift, and overall retrieval quality. Each step is traced from embedding generation through vector search and context assembly, helping teams detect relevance issues early.
Agent workflows: Multi-step agent executions are captured end-to-end, including tool calls, retries, and iteration counts. This visibility helps teams identify inefficient flows and prevent runaway behavior before costs escalate.
Output quality: Braintrust runs the same evaluation scorers in production that teams use during development. Built-in scorers measure relevance, accuracy, coherence, and safety, while custom scorers handle domain-specific quality requirements.
Debug and optimize with Playground
When monitoring indicates a quality issue, Playground lets teams reproduce the exact request that failed. Any production trace can be loaded to test prompt changes, model parameters, or context variations. Side-by-side comparisons across models and configurations make it easier to pinpoint the cause of degradation. Once validated, changes can be converted into code immediately.
Generate custom scorers with Loop
Loop generates evaluation scorers from plain-English descriptions, eliminating the need to write custom evaluation code. Teams describe their quality criteria in natural language, and Loop generates scorers that run on both test data and live traffic. This makes it easy to address domain-specific quality gaps that built-in scorers may miss.
Version control for prompts with Brainstore
Brainstore manages prompt templates as versioned assets with full deployment tracking. When quality scores drop after a prompt change, teams can see exactly which version was deployed and which requests were affected. Prompt versions can be rolled back instantly, and performance can be compared across versions to understand which changes improved results.
Real-time alerting and drift detection
Alerts can be configured on SLO violations for latency percentiles, cost burn rates, quality scores, and error rates, segmented by user, feature, or model version. When an alert triggers, teams can inspect the exact trace spans where the issue occurred.
Braintrust also compares current behavior against historical baselines to detect drift. Input drift highlights changes in query patterns, while output drift surfaces shifts in response style or behavior.
Dashboard and cost analytics
Real-time dashboards highlight metrics that need immediate attention, while longer-term views reveal gradual degradation. Cost breakdowns by user, feature, and model expose inefficiencies and unexpected usage patterns. Quality distributions show whether improvements benefit all users or introduce uneven results.
Deployment gating through CI/CD integration
The native GitHub Action runs evaluation suites on every pull request and posts results directly to the workflow. Releases that reduce quality below defined thresholds are blocked automatically, preventing silent regressions from reaching production.
Solves common monitoring failures
Braintrust avoids common observability pitfalls by segmenting metrics by user group, feature, and model version for granular visibility. Continuous sampling of production traffic catches quality issues that operational metrics alone miss. Alerts are prioritized by business impact and SLO burn rate, so teams are not distracted by low-priority notifications.
Production teams at Notion, Stripe, Zapier, Instacart, Vercel, and Airtable rely on Braintrust for production LLM monitoring because it connects the operational visibility they need with the quality evaluation that traditional application performance management (APM) tools cannot provide.
Start monitoring your LLM applications confidently with Braintrust's free tier, and get 1 GB of processed data and 10,000 evaluation scores per month.
Conclusion
LLM applications succeed or fail in production based on how well they are monitored. Without clear signals across performance, cost, reliability, and quality, teams are left reacting to user reports instead of operating with confidence.
A layered monitoring approach makes complex systems manageable. It helps teams understand where issues originate, measure what users actually experience, and detect degradation before it spreads. Over time, this discipline turns AI development into a predictable engineering practice rather than a series of experiments.
Braintrust provides the complete monitoring infrastructure with quality evaluation in a unified platform built for LLMs. Teams gain faster diagnosis, safer deployments, and consistent behavior in real-world usage. The result is AI software that holds up in production, not just in demos. Get started with Braintrust for free today to monitor your LLMs before hidden quality issues reach your users.
FAQs: LLM monitoring
What is LLM monitoring?
LLM monitoring is the practice of tracking how large language model applications behave in production. It includes operational metrics such as latency, errors, and token costs, as well as quality metrics that evaluate whether responses are accurate, relevant, and safe.
Unlike traditional APIs, LLMs are non-deterministic. The same prompt can produce different outputs, and a request can succeed technically while still returning hallucinated or harmful content. LLM monitoring is designed to detect these failures before they affect users.
What is the difference between LLM monitoring and traditional application monitoring?
Traditional application monitoring focuses on system health. Metrics such as CPU usage, memory consumption, error rates, and response times indicate whether an application is running correctly at the infrastructure level.
LLM monitoring goes further by evaluating the system's output. It measures output quality, safety, and relevance because an LLM can return a successful response code while delivering incorrect or misleading information that traditional monitoring would not detect.
How does LLM observability differ from LLM monitoring?
LLM monitoring assesses whether the system meets predefined expectations. It tracks metrics against thresholds and alerts teams when thresholds are violated.
LLM observability provides deeper insight into why issues occur. It combines metrics with traces, evaluations, and context, allowing teams to connect quality drops to specific prompt changes, model versions, user segments, or workflows. Monitoring detects problems, while observability enables root cause analysis.
What tools do you need for LLM monitoring?
Effective LLM monitoring requires end-to-end tracing to capture prompts, responses, token usage, and execution paths. It also requires evaluation tools that automatically score output quality and dashboards that break down metrics by feature, user group, and model version.
Braintrust provides these capabilities in a single platform. It combines full tracing, built-in and custom quality scorers, production cost analytics, and CI/CD integration that prevents low-quality changes from shipping.
How do I get started with LLM monitoring?
A practical way to get started is to capture all model calls in your application, including inputs, outputs, latency, and token usage, and then establish a small baseline set of representative queries. This gives you a clear view of how your system behaves before and after changes.
You can test this approach by starting with Braintrust's free tier. The free tier automatically captures production traces, includes built-in quality scorers, and lets you evaluate real traffic without committing upfront. This makes it easy to see value early and decide how deeply to invest in monitoring as your system scales.